States’ abortion laws correlate to abortion rates
Americans United for Life (AUL) just released its annual legislative guidebook, Defending Life, which tracks state laws, provides model legislation, and suggests priorities for legislators in each state. [Full disclosure: I once interned at AUL.] AUL also releases an annual ranking, the Life List, which is based on the degree of legal protection each state affords to unborn children. This year, the best (#1) state is Arizona and the worst (#50) state is Washington.
It got me thinking: how does a state’s Life List ranking correlate to its abortion rate? If pro-lifers are correct that legislation can save lives, we would expect to see a relationship. Conversely, if abortion supporters are correct when they claim that pro-life laws do nothing and we’re all just wasting our time, we would expect little or no relationship. Dusting off my AP Statistics knowledge from an embarrassingly long time ago, I decided to dive in.
One problem: abortion data lags several years behind. We can’t compare the just-released Life List to 2017 abortion rates, because the most recent data on abortion rates by state is from 2014. Therefore, at the risk of seeming like old news, I’m going to use the 2014 Life List rankings (#1 Louisiana, #50 Washington) instead. 2014 abortion data, measured by number of abortions per 1,000 women aged 15-44, comes from our loyal opposition at the Guttmacher Institute.
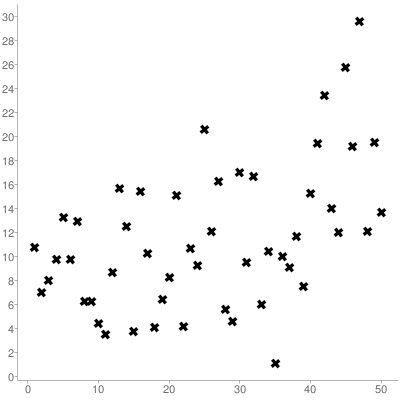
The full data set is at the end of this post. Using a free scatterplot program, here’s what we find:
States with better Life List rankings do tend to have lower abortion rates, while those with poor Life List rankings tend to have higher abortion rates. The correlation coefficient is 0.4733, indicating a moderate relationship.
Certainly there are additional factors at work. Obvious potential confounding variables which I have not controlled for include income, political views, and the relative robustness of social support systems. Wyoming is an interesting outlier, with only 1.1 abortions per 1,000 women of reproductive age despite lackluster legal protections for unborn children. My educated guess is that Wyoming’s low population density makes it impractical for abortion vendors to turn a profit there. (Supporting that hypothesis, Wyoming only has one abortion business.) In other states, I don’t have a way to account for the possibility that the causation runs in both directions; a low abortion rate means less abortion lobby revenue, which could improve the odds that pro-life legislation will pass.
With those caveats, I conclude that while legislation isn’t everything, it is a worthwhile something. The statistics reinforce common sense: both law and culture have a role to play in protecting children from abortion. Get to work in whichever arena suits your skills best!
2014 Ranking, State, Rate per 1000 women aged 15-44
- Louisiana, 10.8
- Oklahoma, 7
- Arkansas, 8
- Arizona, 9.8
- Pennsylvania, 13.3
- Texas, 9.8
- Kansas, 12.9
- Indiana, 6.3
- Nebraska, 6.3
- Missouri, 4.4
- South Dakota, 3.5
- North Dakota, 8.7
- Georgia, 15.7
- Virginia, 12.5
- Mississippi, 3.8
- Michigan, 15.4
- Ohio, 10.3
- Kentucky, 4.1
- South Carolina, 6.4
- Alabama, 8.3
- North Carolina, 15.1
- Idaho, 4.2
- Tennessee, 10.7
- Minnesota, 9.3
- Florida, 20.6
- Colorado, 12.1
- Illinois, 16.3
- Wisconsin, 5.6
- Utah, 4.6
- Rhode Island, 17
- Maine, 9.5
- Delaware, 16.7
- West Virginia, 6
- New Hampshire, 10.4
- Wyoming, 1.1
- Alaska, 10
- Montana, 9.1
- New Mexico, 11.7
- Iowa, 7.5
- Massachusetts, 15.3
- Nevada, 19.4
- Maryland, 23.4
- Hawaii, 14
- Oregon, 12
- New Jersey, 25.8
- Connecticut, 19.2
- New York, 29.6
- Vermont, 12.1
- California, 19.5
- Washington, 13.7


Leave a Reply
Want to join the discussion?Feel free to contribute!